Nginx shows 2 different statuses in the upstream response log
9/26/2019
I am running an nginx-ingress controller in a kubernetes cluster and one of my log statements for the request looks like this:
upstream_response_length: 0, 840
upstream_response_time: 60.000, 0.760
upstream_status: 504, 200
I cannot quite understand what does that mean? Nginx has a response timeout equal to 60 seconds, and tries to request one more time after that (successfully) and logs both requests?
P.S. Config for log format:
log-format-upstream: >-
      {
      ...
      "upstream_status": "$upstream_status",
      "upstream_response_length": "$upstream_response_length",
      "upstream_response_time": "$upstream_response_time",
      ...
      }
-- Ilya Chernomordik
kubernetes
nginx
nginx-ingress
nginx-log
Similar Questions
1 Answer
9/26/2019
According to split_upstream_var method of ingress-nginx, it splits results of nginx health checks.
Since nginx can have several upstreams, your log could be interpreted this way:
- First upstream is dead (504)
upstream_response_length: 0 // responce from dead upstream has zero length
upstream_response_time: 60.000 // nginx dropped connection after 60sec
upstream_status: 504 // responce code, upstream doesn't answer- Second upstream works (200)
upstream_response_length: 840 // healthy upstream returned 840b
upstream_response_time: 0.760 // healthy upstream responced in 0.760
upstream_status: 200 // responce code, upstream is ok
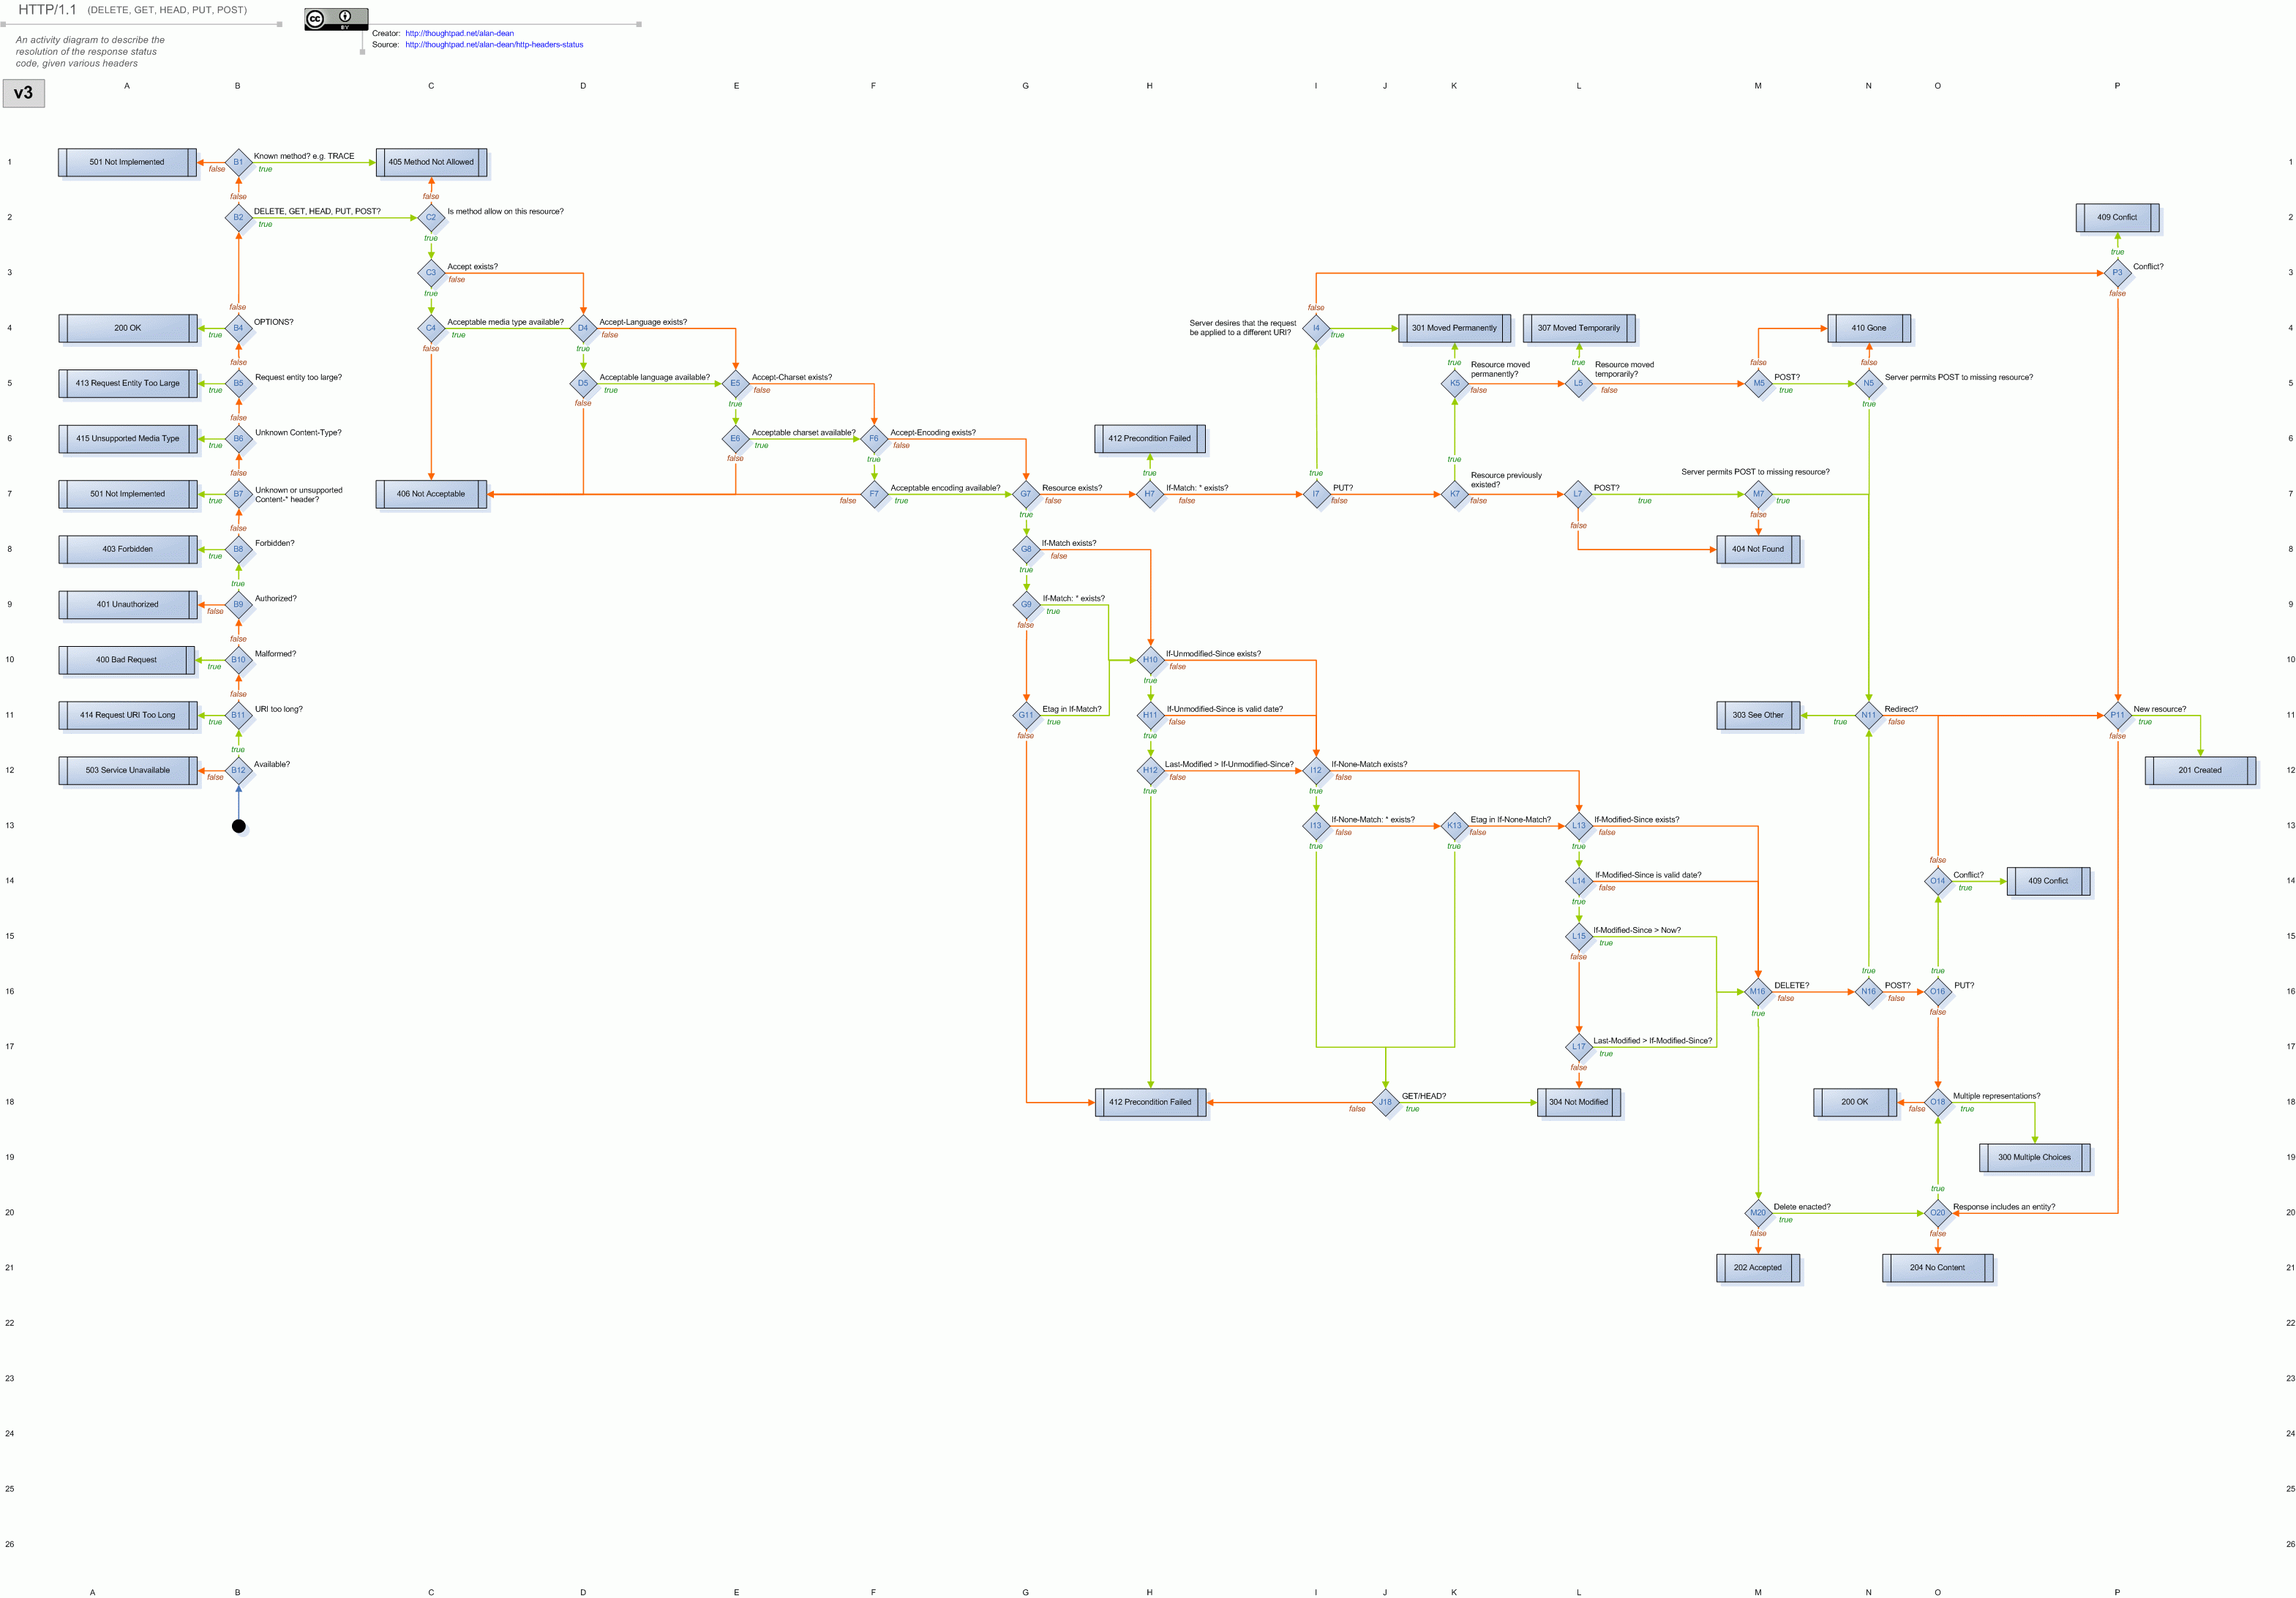
P.S. JFYI, here's a cool HTTP headers state diagram

-- Yasen
Source: StackOverflow